CIO Inbox
Errors of omission vs errors of commission, and which are worse?

Introduction
Many managers have started talking about their underperformance in terms of errors of omission versus errors of commission, where they care to admit that they did in fact commit an error. What exactly are they referring to, why is it important, and which types of errors are worse?
Errors or simply bad luck
It is easy to get sucked into believing that any call that a manager makes that doesn’t pan out (add alpha) is an error, but this would be making a mistake. While the call may in fact be the result of an error made by a manager, some calls may not be errors at all.
One possibility is that the manager actually got the call “right” in terms of the assessment, but the events assessed simply never transpired. A simple example will help to illustrate the point. Let’s imaging that the manager picked heads or tails from the toss of a fair coin. The manager could assess the odds to be even, and therefore wager a bet on these odds, and get the call wrong. This would however not be an error, but simply bad luck. Similarly, a manager could make a call on a stock, using the odds (assessed) that something would happen with the company, and that event may not transpire. It doesn’t mean that the manager’s assessment was wrong.
It is difficult to tell whether a call was in fact right or wrong without complete information, which may not even be available to the manager, but clearly sometimes enough information will be available for the manager to make that assessment themselves.
Omission vs Commission
Errors of omission are the failure by the manager to include a stock in the portfolio, for whatever reason, and that stock goes on to outperform i.e. the manager and investors would have been better off if the stock had been included in the portfolio.
Errors of commission on the other hand are the failure of the manager to exclude a stock from the portfolio i.e. investing in a stock that goes on to underperform the portfolio or benchmark.
People may judge whether one type of error is worse than the other based on behavioural psychology reasons (inertia bias or regret bias), but this does not really address whether there is a more tangible and quantitative reason why one is worse than the other, which we will explore.
The impact on performance
A quantitative approach to this problem, would be to calculate the performance of a given portfolio, without the two types of errors (separately), and to check which version of the portfolio would outperform. Clearly this could change over time, so you would want to check over many independent periods the frequency with which one type of error dominates the others.
This quantitative approach could be performed on actual performance data for a given portfolio say, but you would need the data in order to do so, which may be available to the manager, but not an independent observer. The alternative approach would be to perform a Monte Carlo simulation using certain assumptions that would not imply any specific result. As we do not have access to portfolio data for any given portfolio, we will adopt this latter approach.
Monte Carlo simulation
We could begin by assuming that the relevant market has a given number of shares (say n = 136 for South Africa, but this number doesn’t really matter). We then need to assume that the log returns of these shares follow some distribution (say the Normal distribution, but we could assume a distribution with fatter tails, like the Student-t distribution).
We will also assume that the shares are identically and independently distributed (iid), which implies that there is no market cap premium. If you think this assumption doesn’t hold in practise, you could assume a smaller number of shares (say 40, so no small cap), and get similar results. The implication of this assumption, is that we can then assume that the constituent weights in the index, and the modelled portfolio, are equal, which makes the analysis more tractable as we don’t need to assume a distribution of weights.
We obtained actual share returns for the FTSE/JSE All Share Index for the year ending October 31st 2022, and we get an average return of 1%, and a standard deviation of 31%. We can therefore use these values to generate thousands of simulated returns for the 136 shares in the index.
We can then construct the index return as the average of all these returns, assuming that the weights to each share at the start of the period was equal, and the index was not rebalanced throughout the year. Similarly, we can construct the portfolio by randomly selecting 50% of the shares in the index.
We can now compare the returns of two fictional portfolios, based on the index and portfolio constituents and returns. Portfolio A will represent the portfolio that excludes a number of errors of commission (say one, or more) i.e. we remove the shares that produced the worst returns in the portfolio, and calculate the portfolio’s (A) return excluding those shares. Portfolio B will represent the portfolio that excludes a number of errors of omission i.e. it will include the shares in the index that had the highest returns (that are not already in the portfolio) and calculate the portfolio’s (B) return including those shares. We can now compare these two portfolios to see which outperforms more often, and the average difference in performance.
The results
The table below shows the results of running 10,000 simulations for errors from one to five. It may not be surprising to see the ‘Percentage Outperformance’ numbers dropping as the number of errors increases, but it may be surprising to see the ‘Average Outperformance’ increasing with the number of errors.
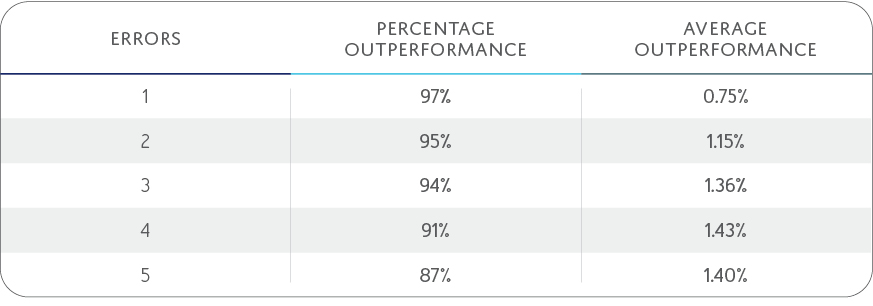
From these results, it is easy to see that on average, errors of omission are worse than errors of commission. This is because your maximum hit on performance in the case of a single error of commission is 100% of the amount invested (less than 2% in our case with 78 shares), which is a relatively small number. A single error of omission however, can account for more than 100% of the amount invested. To October 2022 for example, Thungela Resources, returned over 400%, which would raise the portfolio return by about 8%, if it was not already included in the portfolio i.e. if it was an error of omission.
Conclusion
Although it is difficult to distinguish between errors and bad luck, especially for outsiders without insight into exactly how the analysis of individual shares was done (including assumptions etc.), it is instructive to understand that errors of omission are more likely (on average) to be more costly to performance, than errors of commission. Portfolio managers should therefore pay careful attention to not only the shares that they include in their portfolios, but even more so, to the shares that they choose to exclude, especially if those form part of an index, and even more so the higher their weight in the index.
Technically, this result is just an outcome of the assumption made of how the returns are distributed with positive skew, which seems to hold in practise in most markets and over most periods.
- Errors of commission refers to shares that underperformed and were included in the portfolio, whereas errors of omission refers to shares that outperformed that were not included in the portfolio.
- Errors of omission are more likely (on average) to be more costly to performance, than errors of commission.
- Portfolio managers should therefore pay careful attention to not only the shares that they include in their portfolios, but even more so, to the shares that they choose to exclude, especially those with higher weights in the benchmark.